Solar Panel Installer Warrington (an independent guide) › Homes
How much solar panels make on a Warrington roof
Output depends far more on which way your roof faces than on which part of the borough you live in. Here are PVGIS figures for central Warrington for every direction and pitch, and the month-by-month pattern, so you can check any installer's prediction.
Every direction and pitch
| Roof faces | 10° | 20° | 30° | 40° | 50° |
|---|---|---|---|---|---|
| South | 851 | 900 | 930 | 940 | 929 |
| South-east | 830 | 863 | 881 | 883 | 866 |
| South-west | 830 | 862 | 880 | 881 | 864 |
| East | 780 | 771 | 757 | 735 | 703 |
| West | 779 | 769 | 755 | 734 | 702 |
| North-east | 726 | 668 | 613 | 561 | 510 |
| North-west | 726 | 668 | 613 | 562 | 512 |
| North | 704 | 627 | 551 | 475 | 403 |
PVGIS 5.3 at 53.39° N, 2.597° W: satellite data 2005–2023, 1 kW of crystalline panels, 14% system losses, terrain shading. Read 2026-11-03.
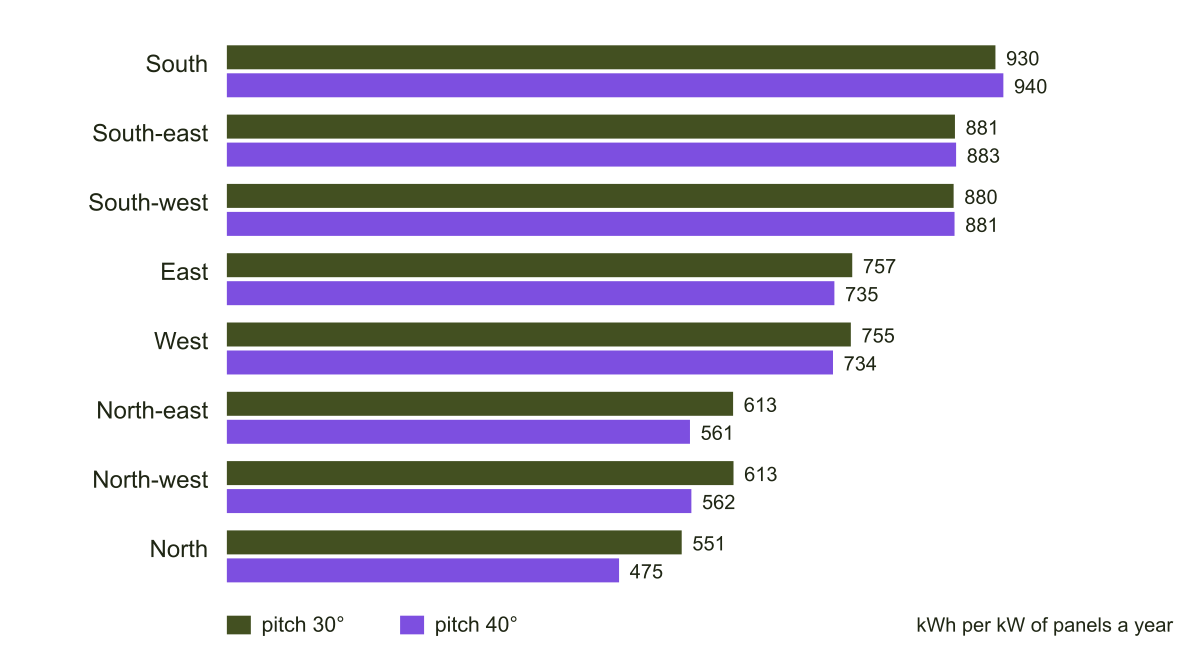
To use the table, find your roof's direction (a compass app on your phone, standing in the garden facing the roof, is good enough) and its pitch (most two-storey houses built since the war are between 30° and 40°; many Victorian roofs are steeper). Multiply the figure by the size of the system in kW. That is the yearly output you should expect before shading, and a fair check on any quote.
Across the borough
| Place | Output |
|---|---|
| Warrington town centre | 938 |
| Birchwood | 932 |
| Great Sankey | 938 |
| Lymm | 932 |
| Culcheth | 926 |
| Stockton Heath | 937 |
| Westbrook | 934 |
| Padgate | 932 |
PVGIS 5.3, same settings, one point in each place.
The whole borough sits within about 13 kWh per kW of itself, roughly 1%. The towns to the west, such as Great Sankey, read fractionally higher than Culcheth in the north-east, but a single tree or a neighbour's extension makes more difference than that.
The year in months
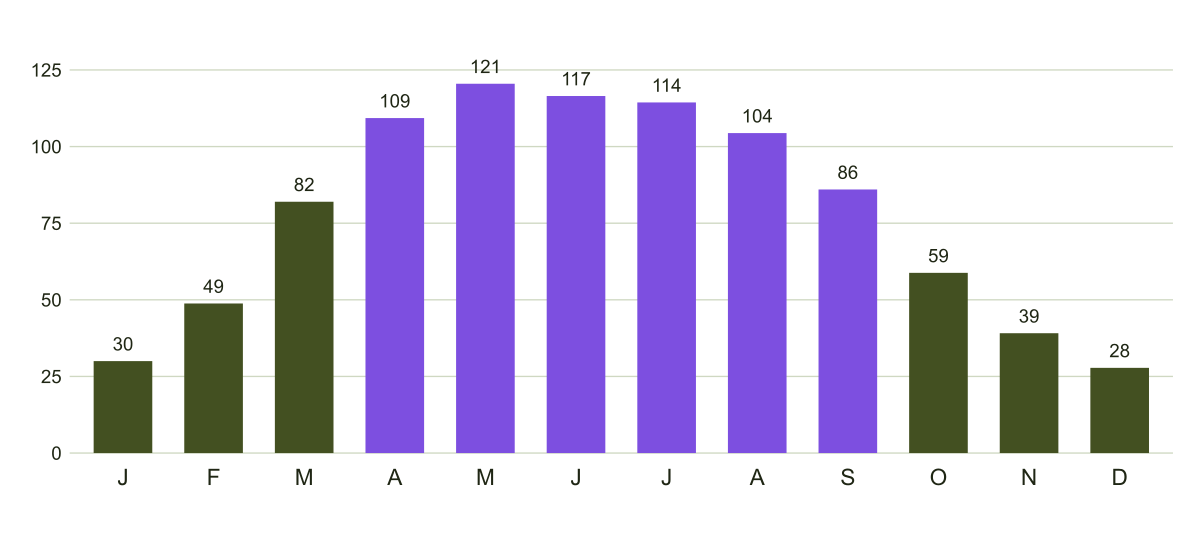
A Warrington roof makes about 121 kWh per kW in May and about 28 in December. Around 69% of the year's output comes between April and September. That is why a system that seems disappointing in its first winter usually looks fine over a full year, and why batteries and flexible tariffs matter.
East and west roofs through the year
The yearly gap between a south roof and an east or west one hides a strong seasonal pattern. Here are the three side by side at 30°, month by month.
| Month | South | East | West | East-west as % of south |
|---|---|---|---|---|
| January | 28.2 | 14.2 | 13.9 | 50% |
| February | 46.8 | 29.1 | 27.9 | 61% |
| March | 80.4 | 60.6 | 59.1 | 74% |
| April | 109 | 92.3 | 91 | 84% |
| May | 121.8 | 111.1 | 112.3 | 92% |
| June | 118.5 | 112.2 | 112 | 95% |
| July | 116.1 | 108 | 109.4 | 94% |
| August | 104.9 | 92.5 | 94.4 | 89% |
| September | 84.9 | 67.5 | 67.1 | 79% |
| October | 56.9 | 38.9 | 38.2 | 68% |
| November | 36.9 | 19.2 | 18.7 | 51% |
| December | 25.9 | 11.4 | 11.2 | 44% |
PVGIS 5.3 monthly output, same settings as the tables above.
In June an east or west roof makes about 95% of what a south roof does; in December it makes about 44%. In proportion the gap is widest in winter, but those are the months when every roof makes little, so over a whole year it narrows to about a fifth. For a house whose ridge runs north to south, panels on both slopes are often the answer: 3 kW on the east slope and 3 kW on the west at 30° would make about 4,536 kWh a year here, against about 5,581 for 6 kW on a single south slope, and the morning and evening output tends to suit a household that is out in the middle of the day.
Walls and balconies
Panels mounted upright on a south-facing wall or balcony make about 685 kWh per kW a year here, around three quarters of a south roof at 35°, though they do comparatively well in winter when the sun is low. Since 27 August 2026 small plug-in devices of up to 800 watts can be used through an ordinary socket; planning rules for walls and balconies changed the same day, so read the planning page first.
What PVGIS does not know
- Shade on your roof. PVGIS includes hills on the horizon but not trees, chimneys or buildings. An installer should assess them.
- The exact equipment. The 14% loss allowance is standard; better inverters and panels can do slightly better, and dirty panels slightly worse.
- A given year's weather. The figures are averages of 2005 to 2023. Individual years vary by a few per cent.
Where to go next
Where these figures come from
Questions about output
What is the best angle for solar panels in Warrington?
About 40° facing due south, which gives about 940 kWh per kW a year by PVGIS. Most Warrington roofs are pitched between about 30° and 45°, close enough that the difference is small.
Do solar panels work on a flat roof in Warrington?
Yes, usually tilted on frames. Laid at 10° facing south they make about 851 kWh per kW a year, against about 930 at 30°.
Does it matter which part of Warrington I live in?
Hardly. Across the borough PVGIS figures for a south roof vary by only about 1%, from Culcheth to Great Sankey. Shade and roof direction matter far more.
Got a solar quote you are not sure about?
Send us the figures, or the question on your mind, with your Warrington postcode. The message comes to SEO-DONS LTD, the company behind this independent guide, and we answer by email. There is no charge and no obligation of any kind.
What happens next
- Fill in the form; a full postcode tells us which part of the borough you are in.
- We look at what you sent and answer by email, with the figures and sources that apply.
- What you do next, and which firm you choose, is entirely up to you.